 Neuerscheinungen 2018Stand: 2020-02-01 |
Schnellsuche
ISBN/Stichwort/Autor
|
Herderstraße 10
10625 Berlin
Tel.: 030 315 714 16
Fax 030 315 714 14
info@buchspektrum.de |

Martijn van Foeken, Xavier Hacking
(Beteiligte)
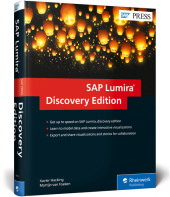
SAP Lumira, Discovery Edition
The Comprehensive Guide
2018. 498 S. 9 in
Verlag/Jahr: RHEINWERK VERLAG 2018
ISBN: 1-493-21612-0 (1493216120)
Neue ISBN: 978-1-493-21612-3 (9781493216123)
Preis und Lieferzeit: Bitte klicken
Are you looking for a better approach to data visualization? Learn what tools SAP Lumira, discovery edition gives you to create interactive charts and infographs! Start by acquiring your data, either offline or live, and explore the available data manipulation actions. Next, create charts, from heat maps and scatter plots to bubble charts and geo maps. Export your data, integrate with SAP BusinessObjects BI, and take a look at your mobile options to get the most out of SAP Lumira, discovery edition!
... Foreword ... 19
... Acknowledgments ... 21
... Introduction ... 23
... Target Group and Prerequisites ... 23
... Structure of the Book ... 23
... Additional Resources ... 27
... Part I: Getting Started ... 29
1 ... Introduction to SAP Lumira, Discovery Edition ... 31
1.1 ... Self-Service Business Intelligence ... 32
1.2 ... SAP Lumira Suite ... 36
1.3 ... SAP Lumira and SAP´s Business Intelligence Portfolio ... 38
1.4 ... Summary ... 45
2 ... Installing SAP Lumira, Discovery Edition ... 47
2.1 ... License Model and 30-Day Trial ... 47
2.2 ... System Requirements ... 50
2.3 ... Downloading SAP Lumira, Discovery Edition ... 51
2.4 ... Installing SAP Lumira, Discovery Edition ... 55
2.5 ... Uninstalling SAP Lumira, Discovery Edition ... 59
2.6 ... Updating SAP Lumira, Discovery Edition ... 61
2.7 ... Tracing ... 63
2.8 ... Summary ... 66
3 ... SAP Lumira, Discovery Edition Interface ... 67
3.1 ... Home Page ... 67
3.2 ... Menu ... 71
3.3 ... Data View ... 86
3.4 ... Design View ... 87
3.5 ... Preview ... 90
3.6 ... Toolbar ... 90
3.7 ... Comparing SAP Lumira 1.x and SAP Lumira 2.x ... 92
3.8 ... Summary ... 94
4 ... Creating Your First Story ... 95
4.1 ... Creating a New Story ... 96
4.2 ... Analyzing Data ... 97
4.3 ... Data Preparation ... 99
4.4 ... Creating a Visualization ... 104
4.5 ... Finalizing Your Story ... 107
4.6 ... Sharing Your Story ... 109
4.7 ... Summary ... 110
... Part II: Data ... 111
5 ... Data Acquisition ... 113
5.1 ... Microsoft Excel ... 114
5.2 ... Text ... 117
5.3 ... Windows Clipboard ... 121
5.4 ... SAP BW ... 124
5.5 ... SAP HANA ... 136
5.6 ... Universe ... 144
5.7 ... Query with SQL ... 149
5.8 ... Dataset Refresh and Edit ... 158
5.9 ... Summary ... 165
6 ... Live Data ... 167
6.1 ... SAP BW ... 168
6.2 ... SAP HANA ... 173
6.3 ... Summary ... 179
7 ... Data Analysis ... 181
7.1 ... Data View ... 182
7.2 ... Grid View ... 183
7.3 ... Facet View ... 185
7.4 ... Summary ... 188
8 ... Data Manipulation ... 189
8.1 ... Objects ... 190
8.2 ... Hierarchies ... 194
8.3 ... Calculated Objects ... 204
8.4 ... Data Actions ... 219
8.5 ... Merging Datasets ... 223
8.6 ... Appending Data ... 227
8.7 ... Configuring Auto-Enrichment ... 229
8.8 ... Summary ... 231
... Part III: Data Visualization and Stories ... 233
9 ... Chart Creation ... 235
9.1 ... Chart Canvas ... 235
9.2 ... Chart Builder ... 238
9.3 ... Visualization Formatting ... 245
9.4 ... Reference Line ... 249
9.5 ... Conditional Formatting ... 251
9.6 ... Summary ... 254
10 ... Crosstabs ... 255
10.1 ... Creating a Crosstab ... 255
10.2 ... Analysis Options ... 259
10.3 ... SAP BW and SAP HANA Live Data ... 264
10.4 ... Summary ... 269
11 ... Comparison Charts ... 271
11.1 ... Bar Chart ... 271
11.2 ... Column Chart ... 274
11.3 ... Marimekko Chart ... 274
11.4 ... Radar Chart ... 276
11.5 ... Tag Cloud ... 277
11.6 ... Heat Map ... 278
11.7 ... Numeric Point ... 279
11.8 ... Summary ... 280
12 ... Percentage Charts ... 281
12.1 ... Pie Chart ... 281
12.2 ... Donut Chart ... 283
12.3 ... Stacked Bar Chart ... 284
12.4 ... Stacked Column Chart ... 286
12.5 ... Funnel Chart ... 287
12.6 ... Summary ... 288
13 ... Correlation Charts ... 289
13.1 ... Scatter Plot ... 289
13.2 ... Scatter Plot for Time Series ... 291
13.3 ... Bubble Chart ... 292
13.4 ... Bubble Chart for Time Series ... 294
13.5 ... Network Chart ... 294
13.6 ... Tree ... 295
13.7 ... Summary ... 296
14 ... Trend Charts ... 297
14.1 ... Line Chart ... 297
14.2 ... Stacked Area Chart ... 300
14.3 ... Waterfall Chart ... 301
14.4 ... Box Plot ... 302
14.5 ... Parallel Coordinates Chart ... 303
14.6 ... Combination Chart ... 304
14.7 ... Summary ... 306


